What is the RSI? The RSI Definition Explained
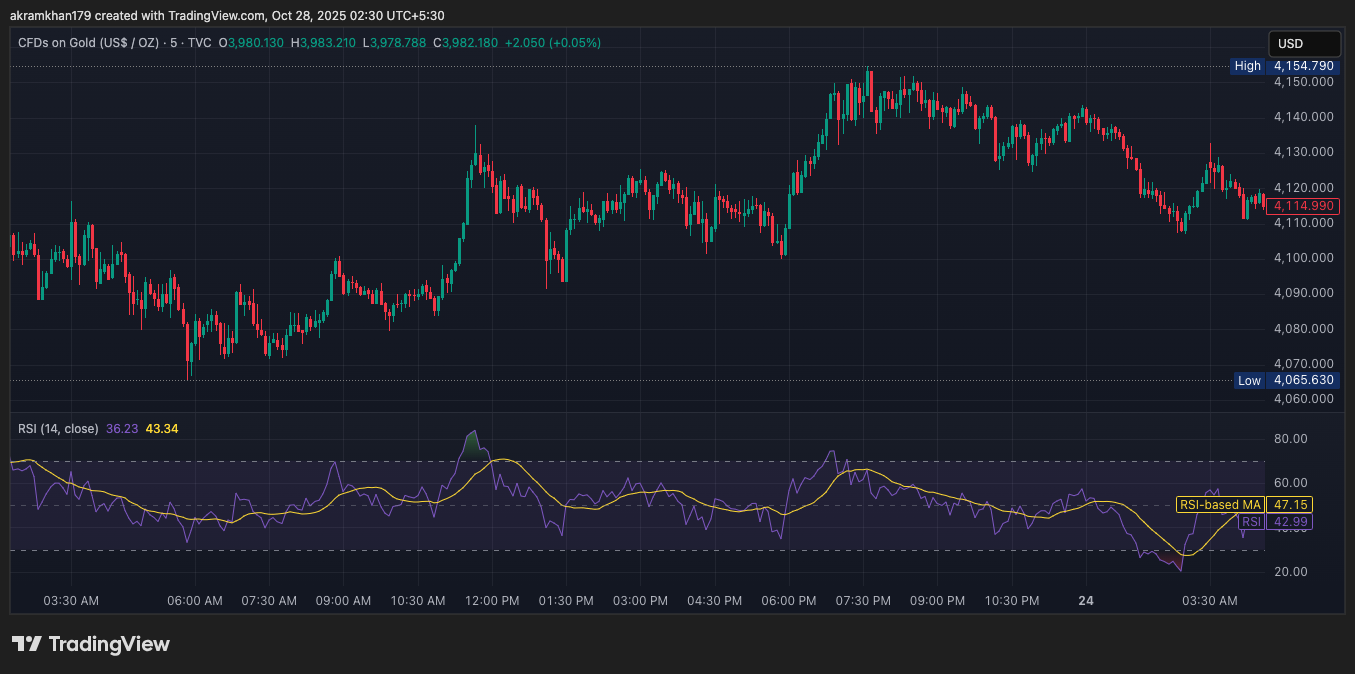
The RSI (Relative Strength Index) is a momentum oscillator that measures the velocity and magnitude of recent price movements, fluctuating between 0 and 100. It is designed to signal overbought and oversold conditions, providing insight into whether a move is emotionally overextended.
https://blog.forexbrokersverified.com/wp-content/uploads/2025/10/RSI-indicator-forex-brokers-verified-com.png
Textbook Interpretation:
- RSI above 70: “Overbought” territory. Suggests a security may be due for a pullback or reversal.
- RSI below 30: “Oversold” territory. Suggests a security may be due for a bounce or reversal to the upside.
- RSI between 30 and 70: Neutral zone where neither buyers nor sellers have a clear upper hand.
The RSI Formula & Calculation: A Deep Dive
While your trading platform calculates RSI automatically, understanding the math behind it is crucial for professional use.
The RSI Formula:
RSI = 100 – [100 / (1 + RS)]
Where RS (Relative Strength) = (Average Gain over n periods) / (Average Loss over n periods)
The default setting uses a 14-period calculation. The formula involves calculating average gains and losses, applying a smoothing technique for subsequent periods, and deriving the RS value to compute the final RSI.
RSI Indicator Levels Explained: Standard 30/70 and When To Adjust Them
The 30 and 70 levels are classic benchmarks, but they should be thought of as warning “tripwires” rather than rigid buy/sell signals.
A signal that an asset may be overbought. In a strong bull market, the RSI can sit between 70-80 for extended periods. It’s a warning, not an automatic sell signal.
A signal that an asset may be oversold. In a strong bear market, the RSI can hover between 20-30. It’s a warning, not an automatic buy signal.
Adjusting Levels: For volatile markets like crypto, use 20/80 levels. In strong trends, use 40-50 (support in uptrends) or 50-60 (resistance in downtrends) for entries. Scalpers on short timeframes often use a 9-period RSI with 20/80 levels.
How to Use RSI in Trading: Strategies & Confluence
The real power of RSI is unlocked when its signals are used as part of a confluence-based trading plan.
Buy Signal: RSI falls below 30, then crosses back above it.
Sell Signal: RSI rises above 70, then crosses back below it.
Works best in ranging markets.
Bullish Divergence: Price makes a Lower Low, RSI makes a Higher Low.
Bearish Divergence: Price makes a Higher High, RSI makes a Lower High.
One of the strongest leading reversal signals.
Apply technical analysis directly to the RSI line. Draw trendlines on the RSI itself. A break of an RSI trendline often precedes a break on the price chart. The 50 level acts as a median; above is bullish bias, below is bearish.
- RSI + Moving Averages: Only take RSI signals in the direction of the 200 EMA trend.
- RSI + MACD: A bullish RSI divergence with a bullish MACD crossover is a high-probability setup.
- RSI + Bollinger Bands: Look for confluence where price touches a band and RSI touches an extreme.
Optimal RSI Settings & Strategies by Trading Style
There is no single “correct” RSI setting. Adapt the period and levels to your trading style and market volatility.
Setting: 14-period RSI
Levels: 30/70
Ideal for capturing multi-day swings and filtering noise.
Setting: 9 or 10-period RSI
Levels: 30/70 or 20/80
More sensitive to intraday momentum shifts on 15-min or 1-hour charts.
Setting: 5 or 7-period RSI
Levels: 20/80
Highest sensitivity for sub-hour timeframes, waiting for powerful momentum moves.
Advanced RSI Concepts: Failure Swings and Zones
Bearish Failure Swing: RSI rallies above 70, pulls back, rallies above the first high, then breaks below the prior pullback low. A strong sell signal.
Bullish Failure Swing: RSI dips below 30, bounces, dips below the first low, then breaks above the prior bounce high. A strong buy signal.
- Oversold Zone: 0-30
- Bullish Zone: 30-50 (support in uptrends)
- Neutral Zone: 50
- Bearish Zone: 50-70 (resistance in downtrends)
- Overbought Zone: 70-100
Common RSI Mistakes to Avoid
- The #1 Mistake: Taking a signal solely because RSI crosses 70 or 30. Always wait for confirmation from a candlestick pattern, divergence, or trendline break.
- Whipsaws in Ranging Markets: RSI zigs and zags in choppy markets, generating false signals. The solution: Don’t trade them. Use the ADX indicator to confirm a trend or wait for a clear breakout.
- Ignoring the Trend: The most reliable RSI signals confirm the trend. An RSI pullback to 40 in an uptrend is often more reliable than a bounce from 30 in a downtrend.