Introduction: The Momentum Master Indicator | When to Buy & Sell – MACD Indicator Simplified
Developed by Gerald Appel in the late 1970s, the MACD has endured as a cornerstone of technical analysis. It works dynamically to determine trend direction, detect shifts in momentum, spot reversals, and time entries and exits across all markets. This guide will provide a step-by-step playbook on When to Buy & Sell – MACD Indicator indicator.
What is MACD in Trading?
The MACD (Moving Average Convergence Divergence) is a momentum oscillator that measures the difference between two exponential moving averages (EMAs) of an asset’s price. It provides a powerful visual representation of both trend strength and momentum.
Why Traders Rely on the MACD:
- Trend Confirmation: Helps confirm the direction and strength of a trend.
- Momentum Measurement: Clearly indicates whether buyers or sellers are in control.
- Universal Use: Works on all timeframes and markets.
How the MACD Works: Deconstructing the Components
The MACD is displayed as three main components on the chart:
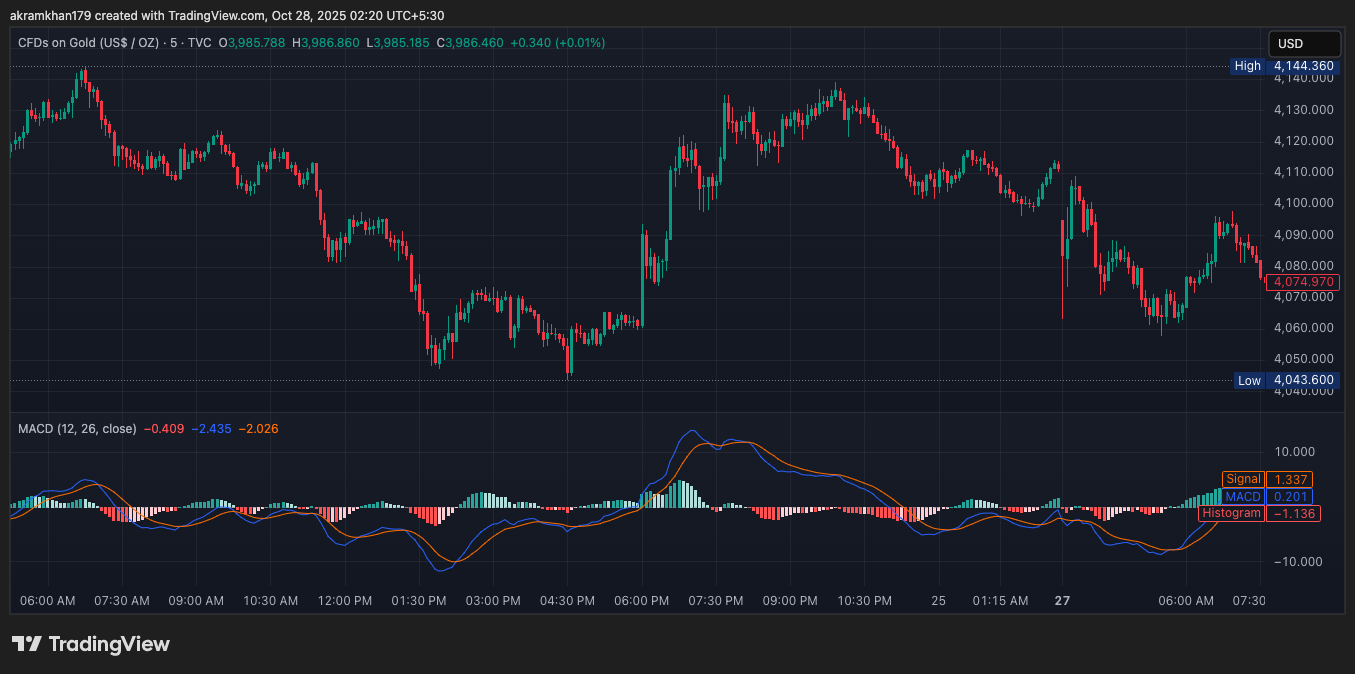
The core of the indicator. Calculated by subtracting the 26-period EMA from the 12-period EMA. MACD Line = (12-Period EMA - 26-Period EMA)
A 9-period Exponential Moving Average of the MACD Line. It acts as a trigger for buy and sell signals. Signal Line = 9-Period EMA of the MACD Line
A visual representation of the difference between the MACD Line and the Signal Line. Histogram = MACD Line - Signal Line. Expanding bars show increasing momentum; contracting bars show decreasing momentum.
MACD Settings Explained: Optimizing for Your Style
The default MACD settings are 12, 26, 9, ideal for identifying the intermediate-term trend.
Use faster settings like (5, 13, 9) or (8, 21, 5) on 1-min to 15-min charts for more sensitive, earlier signals.
The default (12, 26, 9) setting works well on daily or weekly charts for stocks and long-term trends.
Pro Tip: There is no single “best” setting. Experiment and backtest various combinations for your chosen market and timeframe.
How to Use MACD in Trading: A Step-by-Step Process
- Identify the Overall Trend Direction: MACD Line above the Zero Line = Bullish Bias. Below = Bearish Bias. Always trade in the direction of the trend.
- Watch for Key Signals:
- MACD Crossover: Buy = MACD Line crosses above Signal Line. Sell = MACD Line crosses below Signal Line.
- Zero Line Crossover: Stronger trend confirmation. Buy = MACD Line above Zero Line. Sell = MACD Line below Zero Line.
- Divergence: A leading reversal signal. Price and MACD move in opposite directions.
- Execute and Manage the Trade: Enter on confirmation, place stop-losses, and take profits when histogram momentum wanes.
Popular MACD Trading Strategies
Concept: The most common MACD strategy.
Signals:
- Bullish: MACD Line crosses above Signal Line.
- Bearish: MACD Line crosses below Signal Line.
Best for trending markets.
Concept: Gauge the strength of a move using the histogram.
Execution:
- Enter when histogram changes direction and begins to expand.
- Exit when histogram contracts, indicating fading momentum.
Concept: A powerful leading signal for trend reversals.
Signals:
- Bullish Divergence: Price makes a Lower Low, MACD makes a Higher Low.
- Bearish Divergence: Price makes a Higher High, MACD makes a Lower High.
Always wait for price confirmation.
Concept: Combine MACD with other indicators for stronger signals.
Examples:
- MACD + RSI: Filter signals with RSI overbought/oversold levels.
- MACD + 200 EMA: Only trade in the direction of the long-term trend.
MACD in Day Trading & Intraday Trading
The MACD is extremely popular among day traders for its versatility on short timeframes.
How to Apply:
- Timeframes: 1-minute, 5-minute, and 15-minute charts.
- Settings: Use faster settings like
(5, 13, 9). - Method: Look for crossovers in the direction of the short-term trend (MACD line relative to zero line).
For Scalping: Use the MACD to identify short bursts of momentum. Risk management is critical—use tight stop-loss orders and aim for small, frequent profits.
Advantages & Limitations of MACD
- ✅ Versatile: Works on all timeframes and asset classes.
- ✅ Easy to use: Signals are visually simple to interpret.
- ✅ Multifunctional: Offers trend, momentum, and reversal insights.
- ❌ Lagging Indicator: Reacts to price movement, doesn’t predict it.
- ❌ Whipsaws in Sideways Markets: Produces false signals in choppy markets.
- ❌ Divergences Can Be Early: Reversals can take time to play out.
The Solution: Never trade the MACD in isolation. Always confirm signals with price action, other indicators, or market context.
Frequently Asked Questions (FAQs)
Q1: What is the best MACD setting for day trading?
A: Faster settings like (5, 13, 9) or (8, 21, 5) are popular for 1-min to 15-min charts.
Q2: Is MACD good for intraday trading?
A: Yes, it is excellent. Change settings for faster signals and combine with price action analysis.
Q3: How does MACD compare with RSI?
A: They are highly complementary. RSI identifies overbought/oversold conditions, while MACD measures momentum. Use them together.