The Anatomy of a Candlestick: Understanding the Basics
Originally developed by 18th-century Japanese rice trader Munehisa Homma and introduced to the West by Steve Nison, candlestick charts provide four key price points within a specific time period, creating a visual representation of market sentiment. Along with candle sticks, we can also use Candlestick Patterns along with RSI and other confluence indicators.
- Open: Starting price for the period
- High: Highest price reached during the period
- Low: Lowest price reached during the period
- Close: Final price for the period
- Real Body: Rectangle between open and close
- Upper Shadow/Wick: Line from high to body
- Lower Shadow/Wick: Line from low to body
Green/White/Blue Body: Closing price higher than opening price (bullish candle)
Red/Black Body: Closing price lower than opening price (bearish candle)
Color conventions vary by platform but consistently represent bullish/bearish sentiment
Essential Candlestick Types and Their Meanings
Long Green Candle: Large green body, small wicks – strong buying pressure
Bullish Marubozu: Green body, no wicks – extreme buying dominance
Hammer: Small body at top, long lower wick – bullish reversal after downtrend
Long Red Candle: Large red body, small wicks – strong selling pressure
Bearish Marubozu: Red body, no wicks – extreme selling dominance
Hanging Man: Small body at top, long lower wick – bearish reversal after uptrend
Doji: Open/close nearly identical – perfect balance
Long-Legged Doji: Long upper/lower wicks – high volatility stalemate
Dragonfly Doji: Long lower wick – potential bullish reversal
Gravestone Doji: Long upper wick – potential bearish reversal
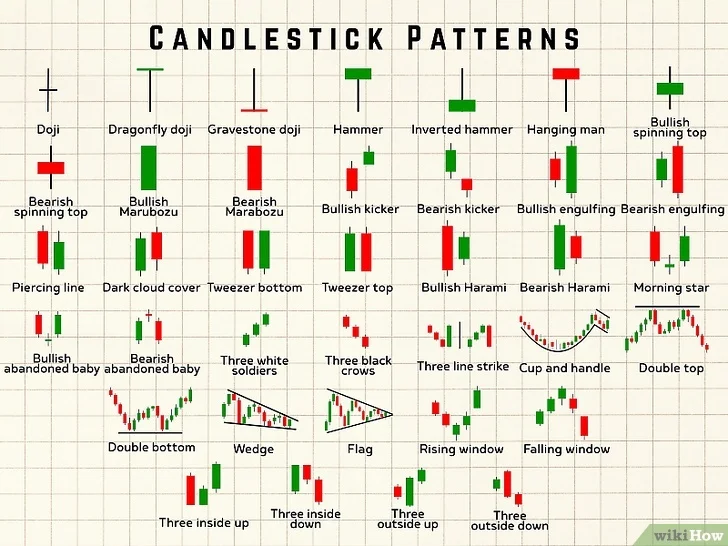
Fundamental Candlestick Patterns for Beginners
Hammer: Downtrend, small body, long lower wick – bullish reversal
Hanging Man: Uptrend, small body, long lower wick – bearish reversal
Inverted Hammer: Downtrend, small body, long upper wick – potential bullish reversal
Shooting Star: Uptrend, small body, long upper wick – potential bearish reversal
Bullish Engulfing: Small red candle engulfed by larger green candle – strong bullish reversal
Bearish Engulfing: Small green candle engulfed by larger red candle – strong bearish reversal
Tweezer Bottom: Two candles with identical lows – potential bullish reversal
Tweezer Top: Two candles with identical highs – potential bearish reversal
Morning Star: Long red, indecision candle, long green – strong bullish reversal
Evening Star: Long green, indecision candle, long red – strong bearish reversal
Three White Soldiers: Three consecutive long green candles – bullish continuation
Three Black Crows: Three consecutive long red candles – bearish continuation
Market-Specific Candlestick Analysis
- Earnings candles show large gaps and unusual bodies
- High-beta stocks show more pronounced patterns
- Institutional block trades create anomalous candles
- End-of-quarter window dressing affects patterns
- Session-based patterns (London, New York, Asian)
- Major pairs show cleaner patterns than exotics
- High-impact news creates long-wicked candles
- Central bank announcements generate volatility
- Frequent very long bodies and wicks
- Weekend trading creates Friday/Monday patterns
- BTC patterns often lead altcoin patterns
- Low-cap tokens may show manipulated patterns
Confirmation Techniques and Confluence
Bullish Patterns: Volume should expand on formation
Bearish Patterns: Volume should increase on pattern completion
Divergence: Decreasing volume decreases reliability
- Moving averages provide support/resistance confluence
- RSI divergence confirms reversal patterns
- MACD crosses validate continuation patterns
- Historical S/R levels enhance pattern significance
Primary Trend: Use higher timeframe for direction
Entry Timing: Use lower timeframe for precise entries
Pattern Significance: Higher timeframe patterns have greater importance
Psychological Aspects of Candlestick Trading
- Confirmation Bias: Seeing expected patterns rather than actual ones
- Pattern Overfitting: Finding random patterns in noise
- Revenge Trading: Trading against failed patterns emotionally
- Fear and Greed: Long wicks show fear, long bodies show greed
- Indecision and Resolution: Doji vs. marubozu candles
- Support/Resistance Psychology: Repeated tests create psychological importance
Learning Resources & Development Plan
Recommended Reading: Japanese Candlestick Charting Techniques (Nison), Encyclopedia of Candlestick Charts (Bulkowski), The Candlestick Trading Bible (Alrajhi)
Online Resources: BabyPips School of Pipsology, Investopedia Candlestick Guide, TradingView Education Center
Development Plan: Weeks 1-4: Pattern Recognition → Weeks 5-8: Pattern Application → Weeks 9-12: Pattern Mastery with real trading