Complete Guide to Trendlines: How to Trade Trendlines Like a Pro
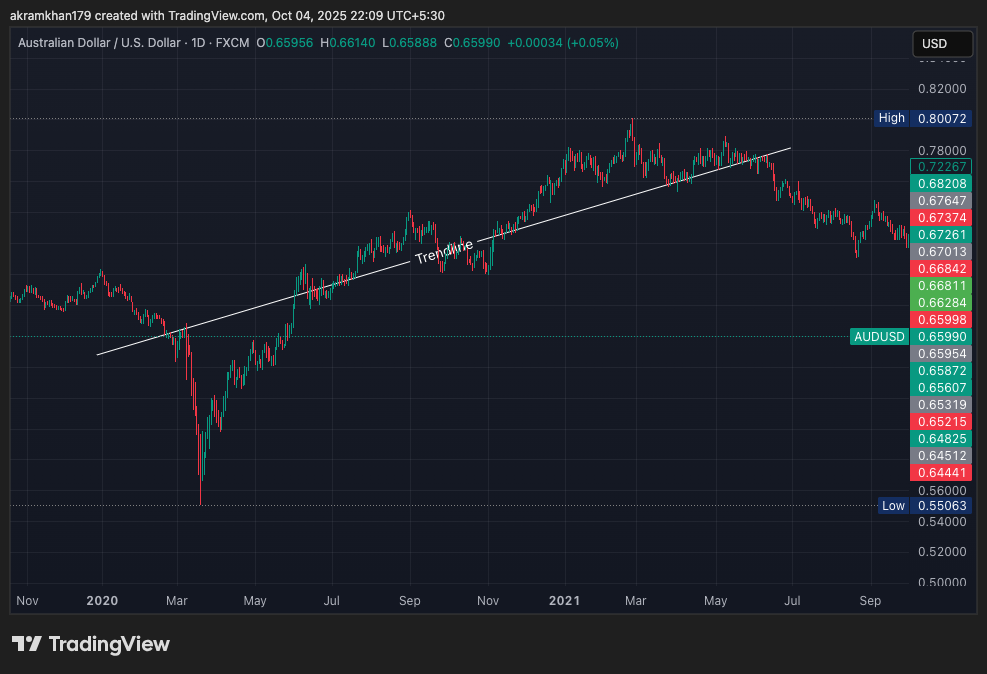
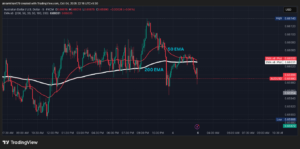
Figure: Trendline analysis on AUDUSD chart showing dynamic support and resistance
A trendline is a straight line drawn on a chart that connects at least two distinct, significant price points (swing lows or swing highs). The line is projected into the future and forms a dynamic level of support or resistance. Price generally “touches” and then respects these lines, making them one of the most fundamental and powerful tools in technical analysis.
Why Trendlines Are Essential for Successful Trading
Dynamic Decision-Making Tool
Trendlines help traders manage risk and find profitable trades by providing clear visual cues about market structure and momentum.
Universal Application
Based on fundamental supply and demand principles, trendlines work effectively in any market and across all timeframes.
Primary Benefits of Using Trendlines
Identify Trend Direction
Instantly visualize if the market is trending up, down, or moving sideways.
Spot Entries and Exits
Interactions with trendlines provide prime locations for continuation bounces or decisive breakouts.
Risk Management
Clear levels for placing stop-loss orders and calculating risk-to-reward ratios.
4 Types of Trendlines Every Trader Should Master
Bullish Support
Bearish Resistance
Range-Bound Markets
Moving Averages
How to Draw Accurate Trendlines: Step-by-Step Guide
Drawing trendlines is both an art and a science. The quality of your lines directly impacts the quality of your trades. Follow this proven methodology:
- Identify Significant Points: For an uptrend, find two distinct higher lows. For a downtrend, find two distinct lower highs.
- Connect the Points: Use a straight line tool to connect your two chosen points precisely.
- Extend into the Future: Extend the line to the right across current and future price action.
- Validate with Third Touch: A trendline gains validity when price touches it a third time and bounces. More touches indicate a stronger level.
The more times price respects a trendline, the more significant it becomes. Always prioritize quality touches over quantity.
Common Mistakes to Avoid
- Forcing the line: Don’t manipulate points to make the line fit your bias
- Wrong connections: Never connect highs to lows – only highs to highs or lows to lows
- Overcomplicating: Too many lines create confusion rather than clarity
3 Proven Trading Strategies Using Trendlines
Trend Continuation
Strategy Overview
Buy (or sell) in the direction of the trend when price bounces off a well-established trendline.
Execution Steps
- Identify a valid trendline with multiple touches
- Wait for price to approach the trendline
- Enter on confirmation of bounce with candlestick patterns
- Place stop-loss on the other side of the trendline
Pro Tip
Wait for a bullish candlestick pattern to form at the trendline before entering. Never trade the exact touch – always wait for confirmation.
Trend Acceleration
Strategy Overview
Buy (or sell) when price breaks through a key trendline in the direction of the breakout, indicating trend acceleration.
Execution Steps
- Identify a significant, well-tested trendline
- Wait for decisive break with closing price beyond the line
- Enter on retest of broken trendline as new support/resistance
- Place stop-loss on the original side of the trendline
Pro Tip
Confirm the breakout with a sudden increase in volume or momentum. Avoid chasing false breakouts by waiting for the retest.
Failed Breakout
Strategy Overview
Sell (or buy) when price breaks through a trendline, then immediately reverses back the other way, indicating a false breakout.
Execution Steps
- Identify a breakout from a significant trendline
- Wait for price to reverse and close back beyond the line
- Enter on confirmation of reversal pattern
- Place stop-loss beyond the recent swing point
Pro Tip
This “fake out” or “bull trap” can be a powerful reversal signal when confirmed with divergence or rejection candlestick patterns.
Advanced Techniques: Confluence and Risk Management
Never use trendlines in isolation. Combine them with other technical tools for higher probability setups:
- RSI: A bounce off a trendline while RSI is oversold/overbought adds significant confirmation
- Moving Averages: A trendline that coincides with a key MA (50, 100, 200) creates a strong support/resistance zone
- Horizontal S/R: The most powerful setups occur where a diagonal trendline intersects with a major horizontal level
- Volume: Increased volume at trendline touches validates the significance of the level
Proper risk management separates professional traders from amateurs:
- Stop-Loss Placement: Always place stop-loss orders on the opposite side of the trendline. This defines your maximum risk.
- Risk-to-Reward Ratio: Every trade should target a minimum 1:2 risk-to-reward ratio. Better setups offer 1:3 or higher.
- Position Sizing: Risk only 1-2% of your account per trade to survive losing streaks and capitalize on winners.
- Trade Validation: If a trendline breaks unexpectedly, exit immediately rather than hoping for recovery.
Case Study: Trading the EUR/USD Downtrend (Q4 2021 – Q1 2022)
Market Context
EUR/USD was in a sustained downtrend driven by diverging central bank policies and economic outlooks between the Eurozone and United States.
Trade Setup Analysis
- Step 1: Drawing the Trendline – Two significant lower highs were connected to form a clear downtrend resistance line
- Step 2: Validation – Price approached the trendline multiple times in December and January, validating it as strong resistance
- Step 3: Trading Opportunity – In February 2022, price touched the line again, signaling a SELL entry after bearish confirmation
- Step 4: Execution – Short entry taken with stop above the swing high and profit target at previous low for >1:2 R/R ratio
- Result: Price respected the trendline and fell several hundred pips to the target, delivering a profitable trade
Instrument: EUR/USD
Timeframe: Daily Chart
Strategy: Bounce Trade
Position: Short
R/R Ratio: 1:2.5
Outcome: Profitable