How to Use Support & Resistance for Profitable Trades


General Definitions and Applications of Resistance

Across all disciplines, resistance fundamentally means to fight, oppose, prevent, counteract, or hinder something from happening. This concept applies to nearly every aspect of life and various specialized fields.

Scientific Contexts
  • Physics: Electrical resistance (R = V/I) measured in ohms (Ω)
  • Engineering: Material resistance to forces, pressure, or damage
  • Medicine: Antibiotic resistance, muscle resistance testing
  • Exercise Science: Resistance training against forces like weights or bands

Psychological & Social Contexts
  • Psychology: Unconscious process of keeping repressed material from awareness
  • Social/Political: Group opposition to authority or power
  • Common Usage: Any force that prevents, stops, delays, or resists progress

Resistance and Support in Trading & Finance

Support and Resistance Trendlines

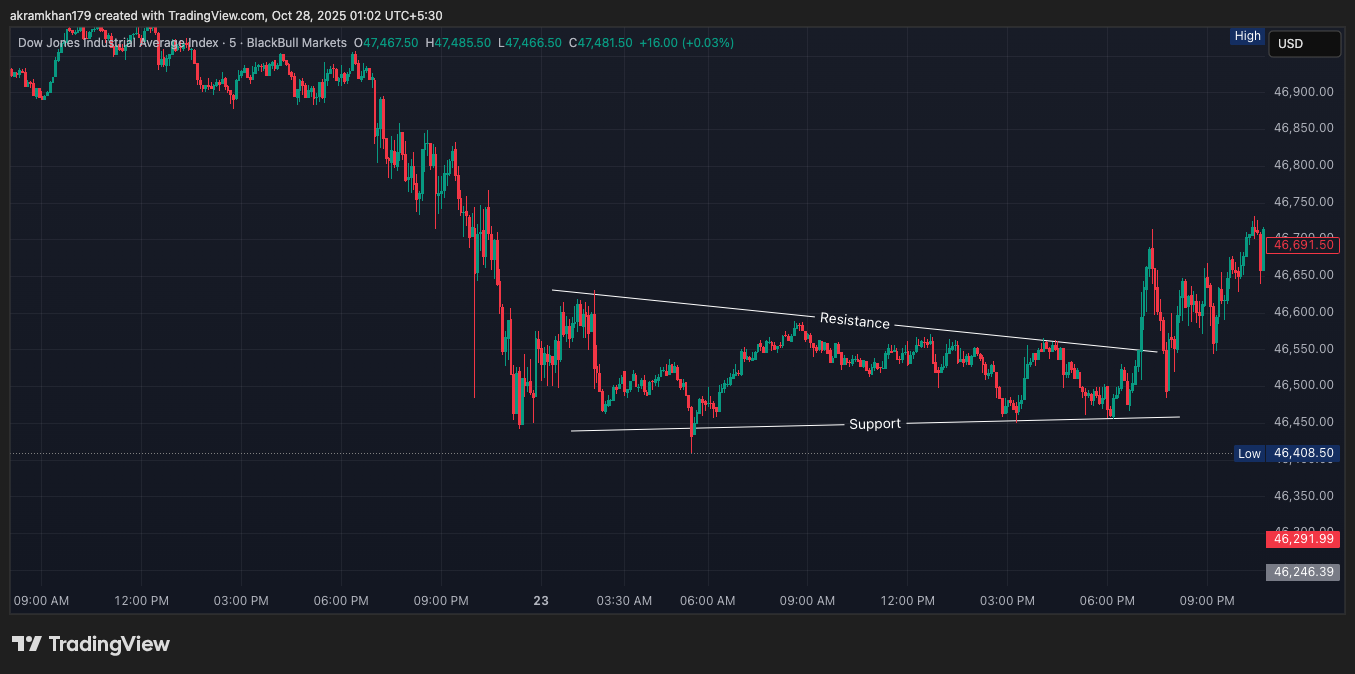
Support and Resistance Image

Support Definition

A price level where buying pressure tends to overcome selling pressure, pushing price back up. Represents an asset’s perceived lower price floor where bears stop selling and bulls start buying.

Resistance Definition

A price level where selling pressure tends to overcome buying pressure, pushing price back down. Represents an asset’s perceived upper price ceiling where bulls stop accumulating and bears start selling.

The Psychology Behind Support and Resistance:

At resistance: Traders who missed selling at previous highs wait to take profits; investors who bought lower happily take profits; previous disappointment creates caution. At support: Traders who missed buying at previous lows wait to enter; investors who sold higher happily buy back; previous success creates confidence.

Identifying Support and Resistance Levels

Horizontal Levels

Form at previous high/low prices. Significance increases with: frequency of reversals, duration of containment, volume at reversals, and alignment with psychological numbers ($100, €1.00, etc.).

Trendlines & Channels

Support forms along upward-sloping trendlines in uptrends; resistance along downward-sloping trendlines in downtrends. Channels use parallel trendlines as dynamic support/resistance.

Moving Averages

Act as dynamic support/resistance: 20-period (short-term), 50-period (medium-term), 200-period (long-term “institutional zone”). Work best in strongly trending markets.

Fibonacci Retracement

Key levels at 38.2%, 50%, 61.8%, and 78.6% retracements. Drawn from major swing low to high (or vice versa). Often coincide with other technical factors.

Pivot Points

Calculated support/resistance based on previous period’s price action: Pivot Point (P) = (High + Low + Close)/3, Support 1 (S1) = (2 × P) – High, Resistance 1 (R1) = (2 × P) – Low.

Trading Strategies Using Support and Resistance

Bounce Trading

Long at Support: Identify strong support, wait for bounce signs (reversal candlestick, divergence, volume), enter long with stop below support, target next resistance.

Short at Resistance: Identify strong resistance, wait for rejection signs, enter short with stop above resistance, target next support.

Wait for decisive break through level with closing price beyond and volume confirmation. Enter in breakout direction with stop on other side of broken level.

Beware of false breakouts. Wait for retest of broken level as new support/resistance or several closes beyond level for confirmation.

Range Trading

Buy near support, sell near resistance in established trading ranges. Use tight stops beyond range boundaries. Works best in low-volatility, range-bound markets. Avoid near earnings reports or major news events.

Advanced Concepts

Role Reversal

After decisive breaks, support and resistance reverse roles: broken support becomes resistance (previous bulls become bears wanting break-even), broken resistance becomes support (previous bears become bulls buying dips).

Confluence Zones

Highest probability areas where multiple support/resistance factors align: horizontal level + trendline, Fibonacci level + previous high/low, moving average + psychological number, volume profile node. Provides tighter stops and more confidence.

Timeframe Relationships

Higher Timeframes: Weekly/monthly levels more significant, institutional decisions, break signals long-term trend changes.
Lower Timeframes: Intraday levels for precise entry/exit timing within larger trends.

Market Context

Trending Markets: Dynamic support/resistance (trendlines, MAs) more reliable.
Ranging Markets: Horizontal levels more reliable.
Volatility: Levels break easier in high volatility, hold better in low volatility.

Psychological Aspects and Trader Behavior

Cognitive Biases
  • Anchoring Bias: Traders anchor to prior significant prices for future predictions
  • Confirmation Bias: Interpret ambiguous price action to match expectations
  • Herd Behavior: Self-fulfilling prophecies from similar orders at known levels

Emotional Challenges
  • FOMO: Anxiety when levels break, leading to premature entries
  • Hope & Denial: Holding losing positions waiting for levels to hold
  • Revenge Trading: Trading against broken levels to “prove” they should hold

Common Mistakes and How to Avoid Them

Technical Errors
  • Over-reliance on Single Levels: Use multiple confirmation methods
  • Ignoring Market Context: Adapt approach to trending vs. ranging conditions
  • Poor Risk Management: Allow room for normal volatility beyond levels

Psychological Errors
  • Predicting Rather than Reacting: Wait for price action confirmation
  • Over-trading: Focus only on highest quality setups
  • Confirmation Bias: Actively seek contrary evidence

Conclusion: Mastering Support and Resistance

Support and resistance represent fundamental psychological price levels that appear across all markets and timeframes. Successful traders understand how to:

  • Recognize different types of support/resistance and identify historically significant levels
  • Use multiple confirmation sources to improve trade probability
  • Combine technical analysis with psychological awareness and rigorous risk management

These concepts remain valuable because they represent the unchanging psychological and behavioral aspects of markets. By mastering support and resistance as part of a comprehensive trading plan, traders can significantly improve their decision-making and performance across all market conditions.

For traders seeking a reliable and well-established broker, XM stands out as a top-tier choice with a proven track record.

Leave a Comment

Your email address will not be published. Required fields are marked *

Scroll to Top