Introduction: A Dynamic Indicator for Volatility and Trends
Created in the 1980s by John Bollinger, this indicator has stood the test of time. Its real power lies in its versatility. It provides a visual representation of market volatility, helping you instantly identify calm/ranging vs. chaotic/trending markets, and offers practical ways to spot potential reversals and breakouts.
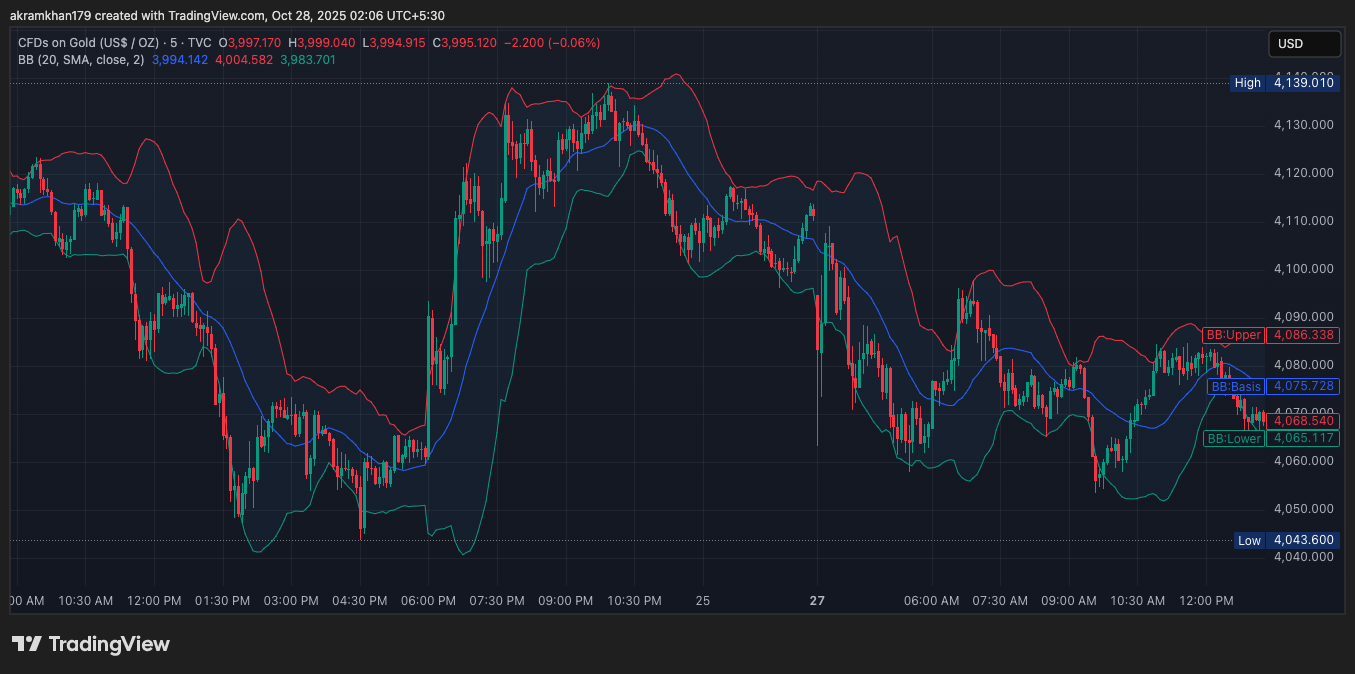
What Are Bollinger Bands? Deconstructing the Three Lines
The Bollinger Bands indicator is made up of three lines that create a dynamic channel around price action:
The Three Components:
- The Middle Band: A simple 20-period moving average (SMA). This smooths out price action and indicates the medium-term trend.
- The Upper Band: The Middle Band plus two standard deviations of price.
- The Lower Band: The Middle Band minus two standard deviations of price.
Note on Terminology: Commonly misspelled as Bolinger, Bilinger, or Boilinger Bands, they all refer to the same indicator. The channel “breathes” with market volatility—contracting in low volatility (“squeeze”) and expanding when volatility spikes.
How Do Bollinger Bands Work? The Magic of Standard Deviation
The genius of the indicator is its use of standard deviation, a statistical measure of volatility that shows how spread out price is from its average.
- The Middle Band (20 SMA) provides the baseline average price.
- Standard Deviation calculates how much price deviates from that average.
- The Bands (SMA ± 2 Standard Deviations) create a channel that encompasses approximately 95% of all price action under normal conditions.
This statistical basis makes price-band interactions significant. A “squeeze” (bands close together) indicates extremely low volatility and often precedes a large price move.
How to Read Bollinger Bands: Price and Band Interaction
Reading Bollinger Bands is about interpreting the relationship between price and the three lines:
A sign of strength and trend continuation in an uptrend. Not an automatic sell signal.
A sign of weakness and trend continuation in a downtrend. Not an automatic buy signal.
Bands converge, indicating extremely low volatility. Often precedes a sharp directional breakout.
Bands widen, indicating high volatility. Common during strong trends or potential exhaustion points.
How to Use Bollinger Bands in Trading: A Practical Setup Guide
- Add the Indicator: Use default settings (Period: 20, Standard Deviation: 2.0).
- Determine Market Context: Is the market trending (bands expanding, price hugging one band) or ranging (price bouncing, bands flat)?
- Identify Key Signals:
- Trend: Price above middle band = bullish bias. Below = bearish bias.
- Extremes: Upper band touch = potential overbought. Lower band touch = potential oversold.
- The Squeeze: Anticipate a breakout.
- Define Entry/Exit: Buy near lower band for a bounce, buy a break above upper band in a squeeze, use middle band as a take-profit zone.
Optimizing Settings:
Swing Traders: Default 20/2.
Scalpers: 10-period SMA with 1.5 deviations.
Long-Term Investors: 50-period SMA with 2.5 deviations.
Popular and Profitable Bollinger Band Strategies
Setup: Identify a strong band squeeze.
Trigger: Price decisively closes above/below a band with momentum.
Execution: Enter in breakout direction, stop-loss on other side of middle band.
Setup: Price breaks above upper band.
Confirmation: MACD shows bullish crossover above zero line.
Execution: High-confidence buy signal. Opposite for sells.
Setup: Market is non-trending, price oscillating.
Signal: Price touches lower band and forms a bullish reversal candlestick (e.g., hammer).
Execution: Go long, stop below swing low, target middle band.
Advanced Concepts and Risk Management
Mastering Bollinger Bands requires advanced confluence and strict risk management.
- With RSI: Price at lower band + RSI below 30 (oversold) = powerful long confirmation.
- With Major MAs: Only trade buy signals above the 200 MA, sell signals below it.
The Biggest Mistake: Selling at an upper band touch in a strong bull trend.
The Solution: Wait for confirmation (e.g., bearish candlestick, RSI divergence) before acting.
Common Questions & Misconceptions
Q: Are Bollinger Bands reliable by themselves?
A: They are powerful but work best as one element of confluence in a broader strategy to avoid false signals.
Q: How is a squeeze different from a breakout?
A: The squeeze is the setup (low volatility). The breakout is the trigger that begins the move.
Q: Why do my bands look different?
A: Check that period, deviation, and the type of moving average (SMA vs. EMA) are identical across platforms.